Income patterns in voting at the 2024 UK general election
A hidden but persistent relationship

The observation that the relationship between income and voting has weakened significantly over time is a common one in British politics1. Whereas once the Conservatives held a clear advantage amongst high income voters, and Labour chiefly represented those on lower incomes, this no longer seems to hold. The 2024 election ostensibly represents the culmination of this trend. Some pollsters even found a slight reversal of the historic pattern, with Labour performing best amongst high income voters2.
In this post, I suggest we should be careful not to write off the importance of income in voting behaviour just yet. Chiefly, this is because of the growing importance of another demographic factor in structuring British politics: age. The growth of age as a predictor of vote choice significantly complicates and obscures income-based voting patterns. Older voters – who the Conservatives have performed increasingly well amongst over the past decade or so – tend to have lower income levels. This doesn’t necessarily mean they feel more economically insecure though. Older voters typically own their homes and, as their children age and flee the nest, are often exposed to significantly lower living costs. As such, it is possible that the Conservative’s recent growth in support from lower income voters – and equally, Labour’s with high income voters – simply reflect this reorientation around age, and obscure income-based voting patterns within age groups. Here, I use BES data to show that this is indeed the case3.
Figure 1: vote choice and income at the 2024 UK General Election. Source: BES
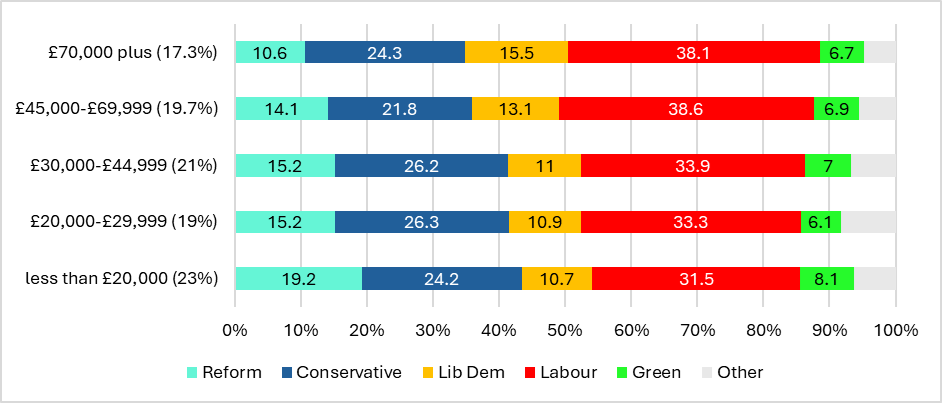
Figure 1 shows the share of support amongst each household income group for the five biggest parties (in terms of vote share) at the 2024 general election. Consistent with other sources, the relationship between household income and both Conservative and Labour voting appears to be weak. Labour even appear strongest amongst the higher income groups. There does seem to be a significant association between Reform voting and income, though, with those in the lowest income group almost twice as likely to have voted Reform as the highest income voters. Income seems moderately correlated with Lib Dem voting and relatively unrelated to Green support. But, as suggested above, it may be that the effect of age is obscuring income-based voting. Moreover, income here is captured at the household level. Obviously, how many people live in the household - again, something which interacts strongly with age - is therefore important in determining just how far this income goes. A single pensioner living on £50,000 a year is in a very different position to a family of five with the same income.
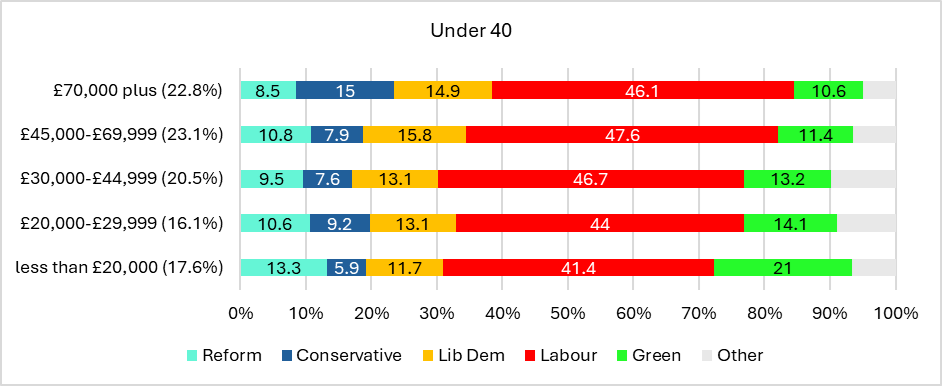
Let us then consider the relationship between income and voting when broken down by age. Figure 2 shows the relationship between income and voting amongst two age groups: under 40s and over 55s. Note first how the income distribution varies by age – in brackets I show the share of each income group in the sample. Those in households with incomes of over £45,000 represent 46% of those under 40 compared to just 24% of those over 55, with those on the lowest incomes also forming a significantly higher share of over 55s. Again, this does not mean that older voters are worse off – they are exposed typically to far lower housing and living costs – but you can see how it might influence the income-voting patterns observed above. Indeed, there is a stronger relationship between income and voting when considered by age group. The Conservatives perform stronger amongst high income voters in both groups – with the pattern especially steep amongst younger voters. The Greens also enter the equation; amongst younger voters, they are clearly the party with which low income is most strongly associated, whilst Reform support exhibits a low income skew in both groups. Interestingly, for Labour there remains no strong relationship in either group.
Figure 2: vote share by household income group by age group at the 2024 UK General Election. Source: BES
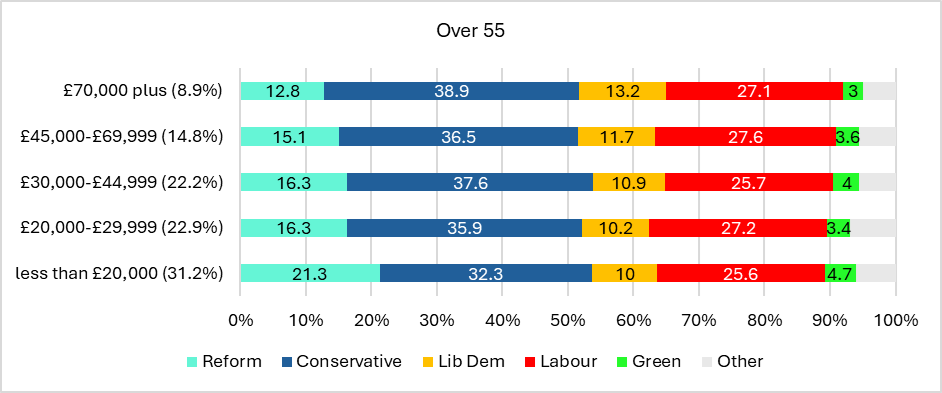
Let me now more systematically consider how the relationship between income and voting changes when age is accounted for. Below I show the results from some logistic regression models. These show the effect of being in the highest household income group (£70,000 plus per year) versus the lowest income group (£20,000 or less per year) on voting for each party both before and after age - as well as household size - are controlled for. Once age and household size are held constant, different patterns emerge. Most notably, Conservative voting goes from being unrelated with income to being very strongly associated with high income. Labour voting is no longer positively associated with income once you account for age and household size, instead becoming unrelated. Interestingly, Green voting becomes strongly associated with low income once you account for household size and age.
Figure 3: effect of income on voting for each party at the 2024 UK General Election, before and after controlling for age and household size. Source: BES
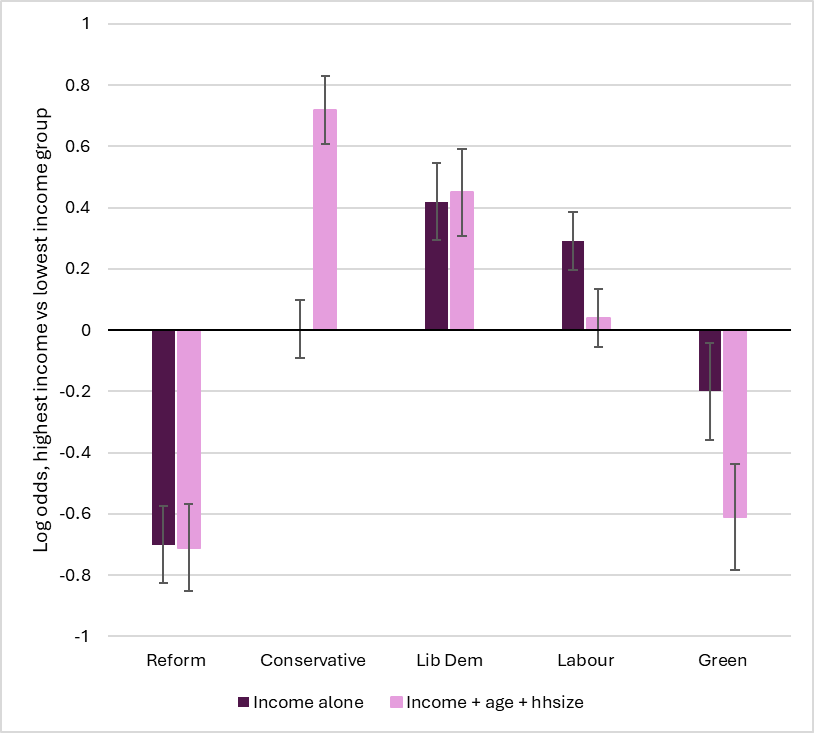
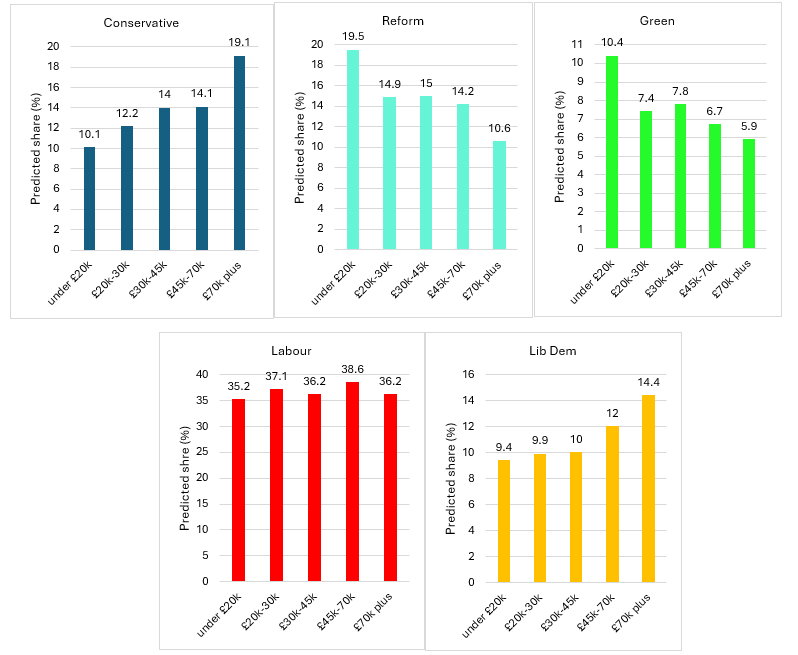
For a more intuitive sense of what this means, we can calculate from these models the predicted probabilities of those in different income groups voting for the parties once age and household size are held constant. Below, I show the predicted probability by income group of someone voting for each party who is 45 years old and living in a household of three. The results reinforce how, once age and household size are accounted for, strong income-based voting patterns are present in support for the Conservatives, Reform, and the Greens. Compared to somebody in the lowest income group, a voter in the highest income group is around twice as likely to vote Conservative, whilst being around half as likely to support the Greens or Reform. However, income remains relatively unrelated to support for the Labour party and relatively weakly correlated with voting Lib Dem.
Figure 4: predicted probability of voting for each party by income group for somebody aged 45 and in a household of 3 people. Source: BES
Altogether, income based voting patterns persist in British politics, despite being hidden by a growing age divide. Although a lot of recent commentary has suggested a fundamental realignment in the class basis of Tory voting, the Conservatives remain the party whose support is most strongly associated with affluence. Whilst the low income skew of the Reform vote is perhaps unsurprising, where the Greens are concerned it runs counter to the common (mis-)characterisation of their base as being marked by economic security or privilege4.
These findings speak to the importance of taking seriously the transformations in social and class structures which have occurred over recent decades. Population aging and housing market financialisation, amongst other things, have important implications for social stratification and inequality, and have complicated how traditional measures of class position - such as household income - are best understood or utilised. We are seeing the growth of groups who defy traditional class characterisation. Low income, older people who are nevertheless asset rich and economically secure, and younger, higher earners who are rendered insecure through exposure to eyewatering housing and childcare costs are two of these. We need to remain aware of this in our characterisation of the social bases of politics. This is something I hope to explore further in future versions of this blog.
https://www.jrf.org.uk/public-attitudes/low-income-voters-the-2019-general-election-and-the-future-of-british-politics
https://yougov.co.uk/politics/articles/49978-how-britain-voted-in-the-2024-general-election
I use data from the BES’s post-election wave. Available here: https://www.britishelectionstudy.com/data-objects/panel-study-data/
There are several articles from various right-leaning outlets I could have linked here as examples, but I shall refrain from giving them the satisfaction.